
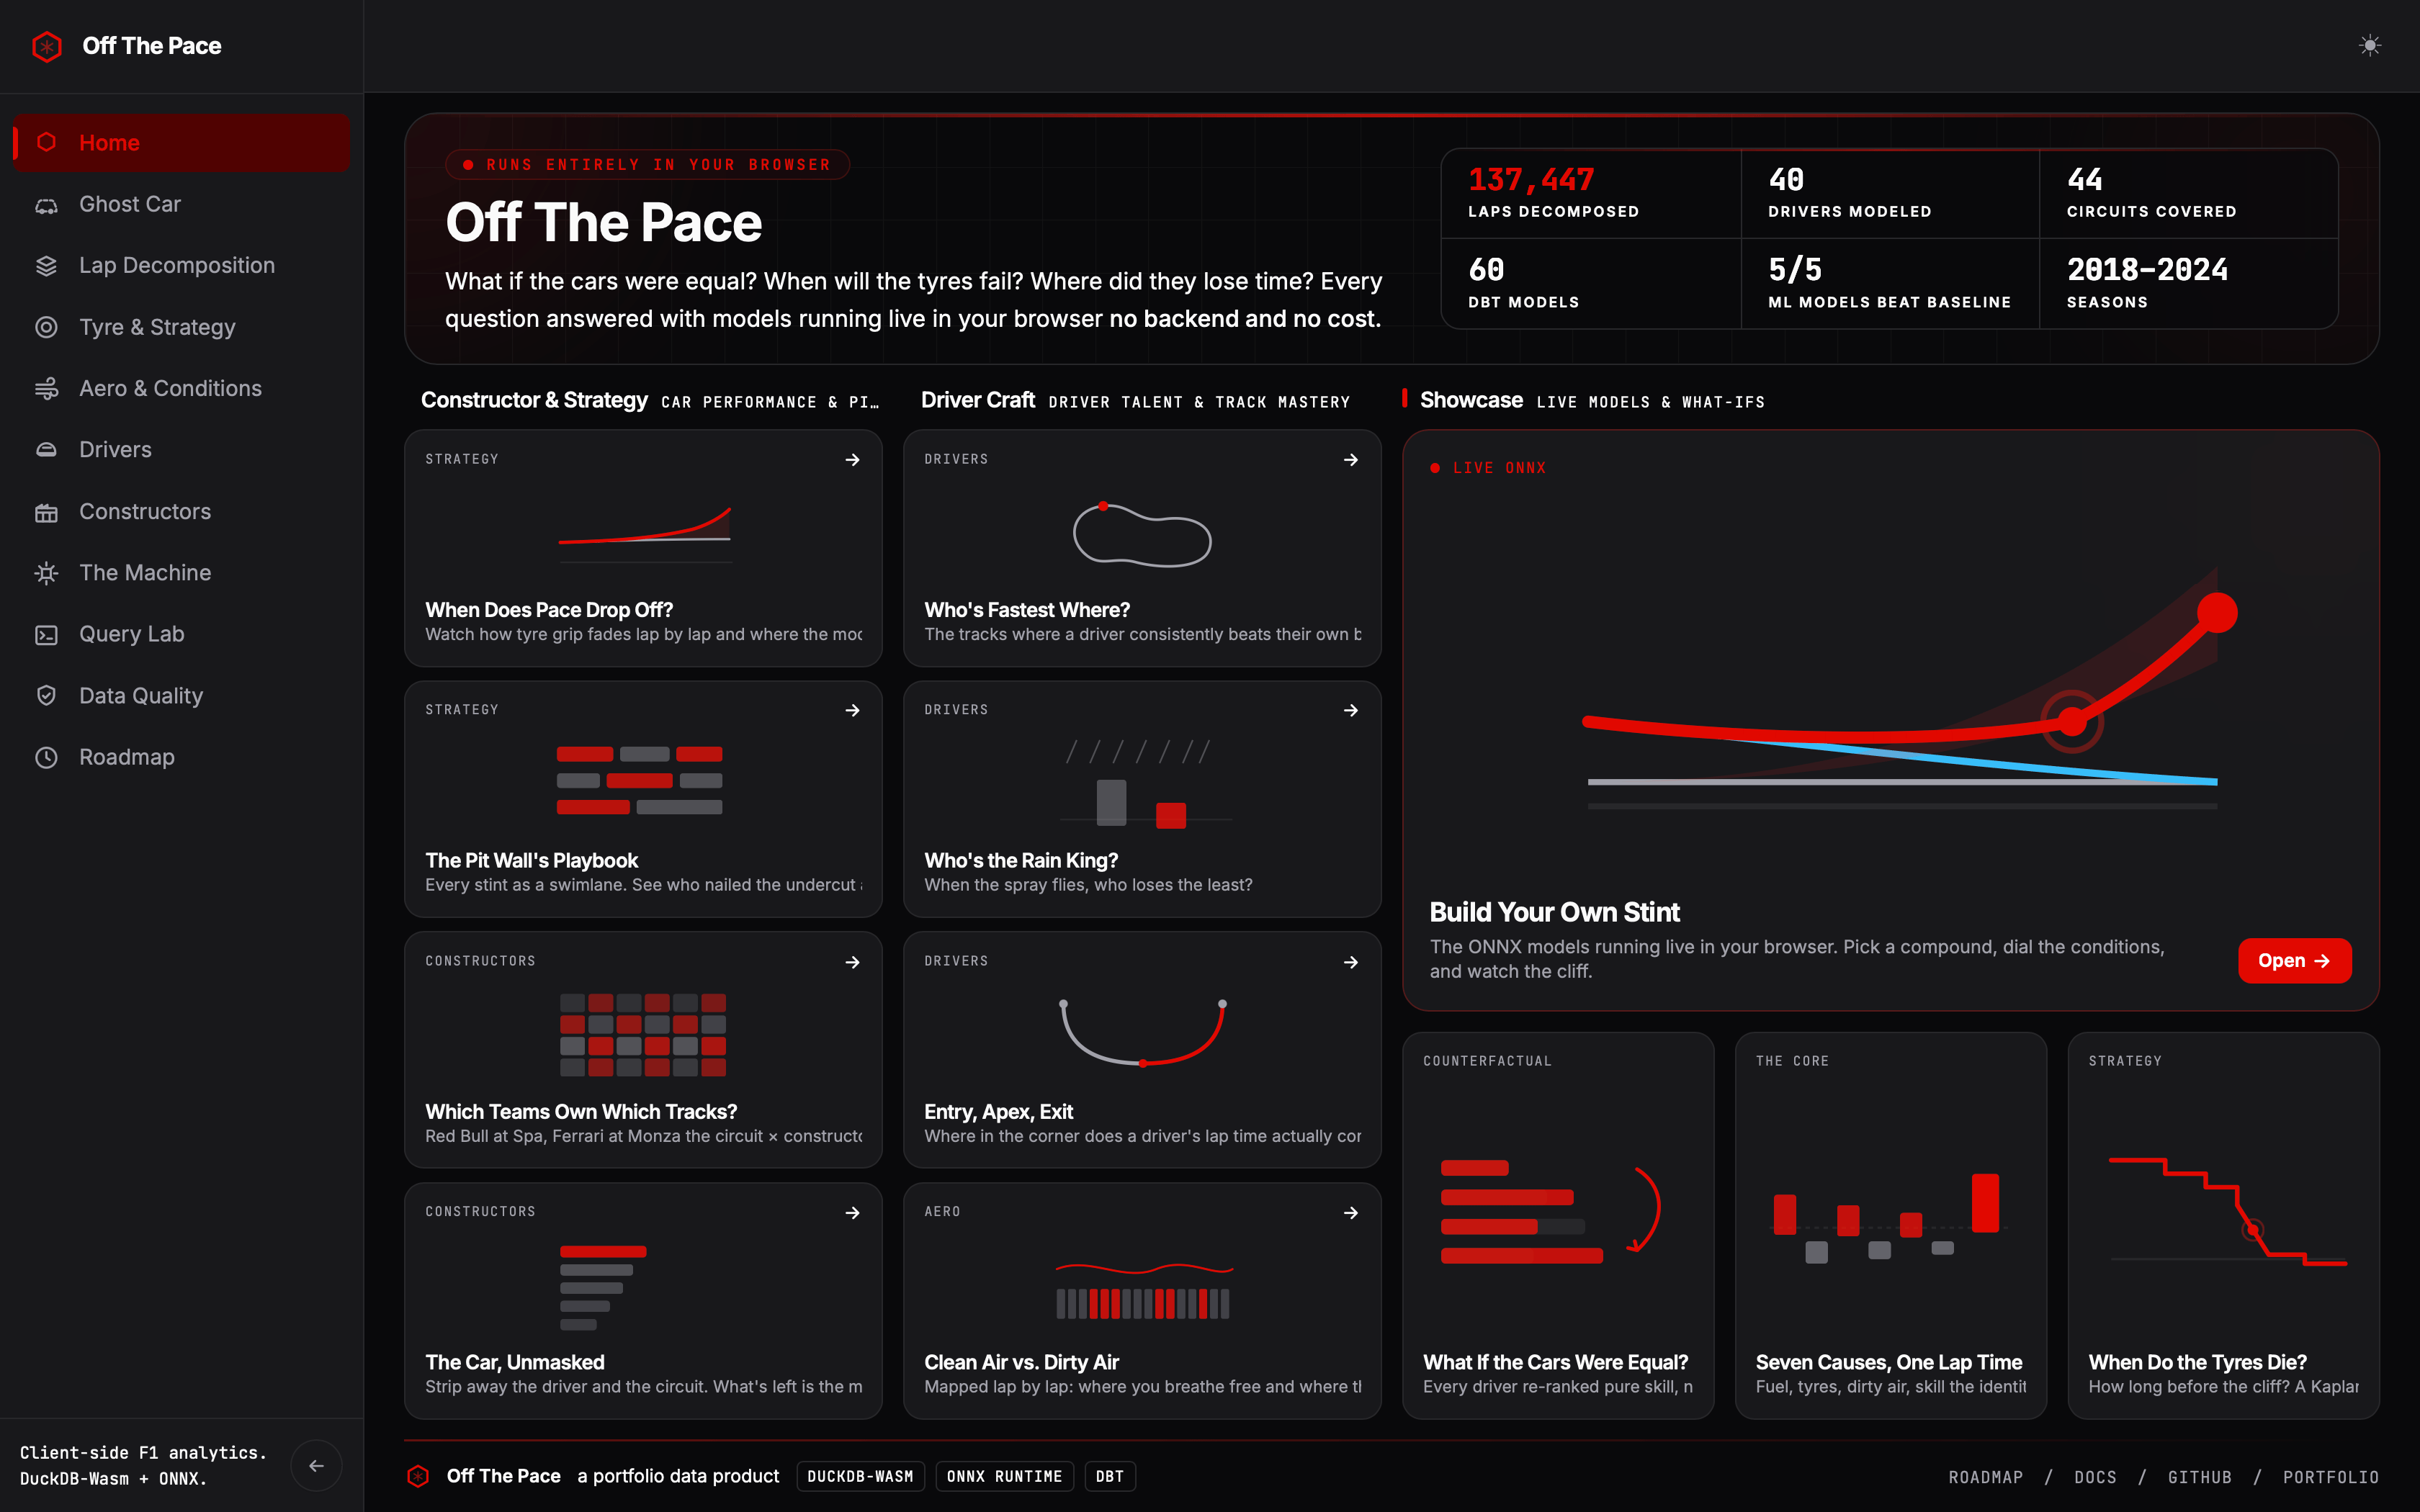
The Off The Pace home dashboard showing lap decomposition analytics, driver ratings, and strategy projections running entirely client-side.
Are you here to…
Evaluate the work
The sixty-second tour for a reviewer: the eight things to notice, then the skills demonstrated and who built it.
Assess the system
The architecture, the build-time vs request-time split, and how it clears a production data-engineering bar.
Use or run it
Clone the repo and ingest your first race, or launch the live app.
How the pipeline fits together
Raw timing data becomes an interactive chart through four layers, each documented in its own tab:Data
Where the timing data comes from and how to ingest it yourself.
Transform
The seven-term decomposition: dbt models enforced by a CI contract.
Machine Learning
XGBoost models predicting tyre cliff onset and degradation, exported to ONNX.
App
The browser app every chart and simulator above ships from.
By the numbers
7 seasons
2018–2024 of F1 timing data ingested end to end.
149 races
Every lap decomposed and verified against the additive identity.
72 dbt models
620 tests enforce the pipeline on every build.
5 ML models
XGBoost trained, exported to ONNX, running live in the browser.
30 app features
Interactive visualizations, zero server, sub-10ms queries.
0ms server
DuckDB-Wasm + ONNX Runtime Web run the whole stack client-side.
The stack
Data Pipeline & ML
FastF1
Telemetry & lap timing API
Jolpica
Championship standings & pit API
Python
Ingestion & orchestration
DuckDB
In-process data warehouse
dbt
Transform layer & data tests
XGBoost
Gradient-boosted models
App & Inference
React + Vite
App framework & build tool
DuckDB-Wasm
In-browser SQL analytics
ONNX Runtime Web
In-browser ML inference
Infrastructure
Google Cloud Storage
Gold-mart CDN
Firebase
Static hosting
GitHub Actions
CI: tests, drift gates, deploy
What you can do
Degradation Simulator
Dial in a stint compound, fuel load, and dirty air and watch the trained models project pace loss and cliff risk live.
Ghost Race Standings
Every driver re-ranked in equal machinery a counterfactual championship built from the structural pace model.
Lap Decomposition Waterfall
Any lap, any driver: seven causes stacked into one bar that always closes to zero.
Tyre Cliff Survival
How long each compound lasts before the cliff, by circuit and season.
1
A question
“Did Mercedes’ pit call or Hamilton’s driving win São Paulo 2021?”
2
A decomposition
fct_lap_residuals splits every lap of the race into fuel, tyre, rubber, ambient, constructor, dirty-air, and driver-skill components see the case study.3
A model
The same physics terms feed the ONNX degradation models that power the live simulator.
4
A chart
The React app queries the gold Parquet mart with DuckDB-Wasm and renders the answer client-side, in milliseconds.
Key Concepts
The vocabulary used throughout the docs pace delta, clean laps, the tyre cliff.
Quick Start
Clone the repo and ingest your first race in five minutes.
Case Studies
Real race decompositions, starting with Hamilton vs Verstappen at São Paulo 2021.